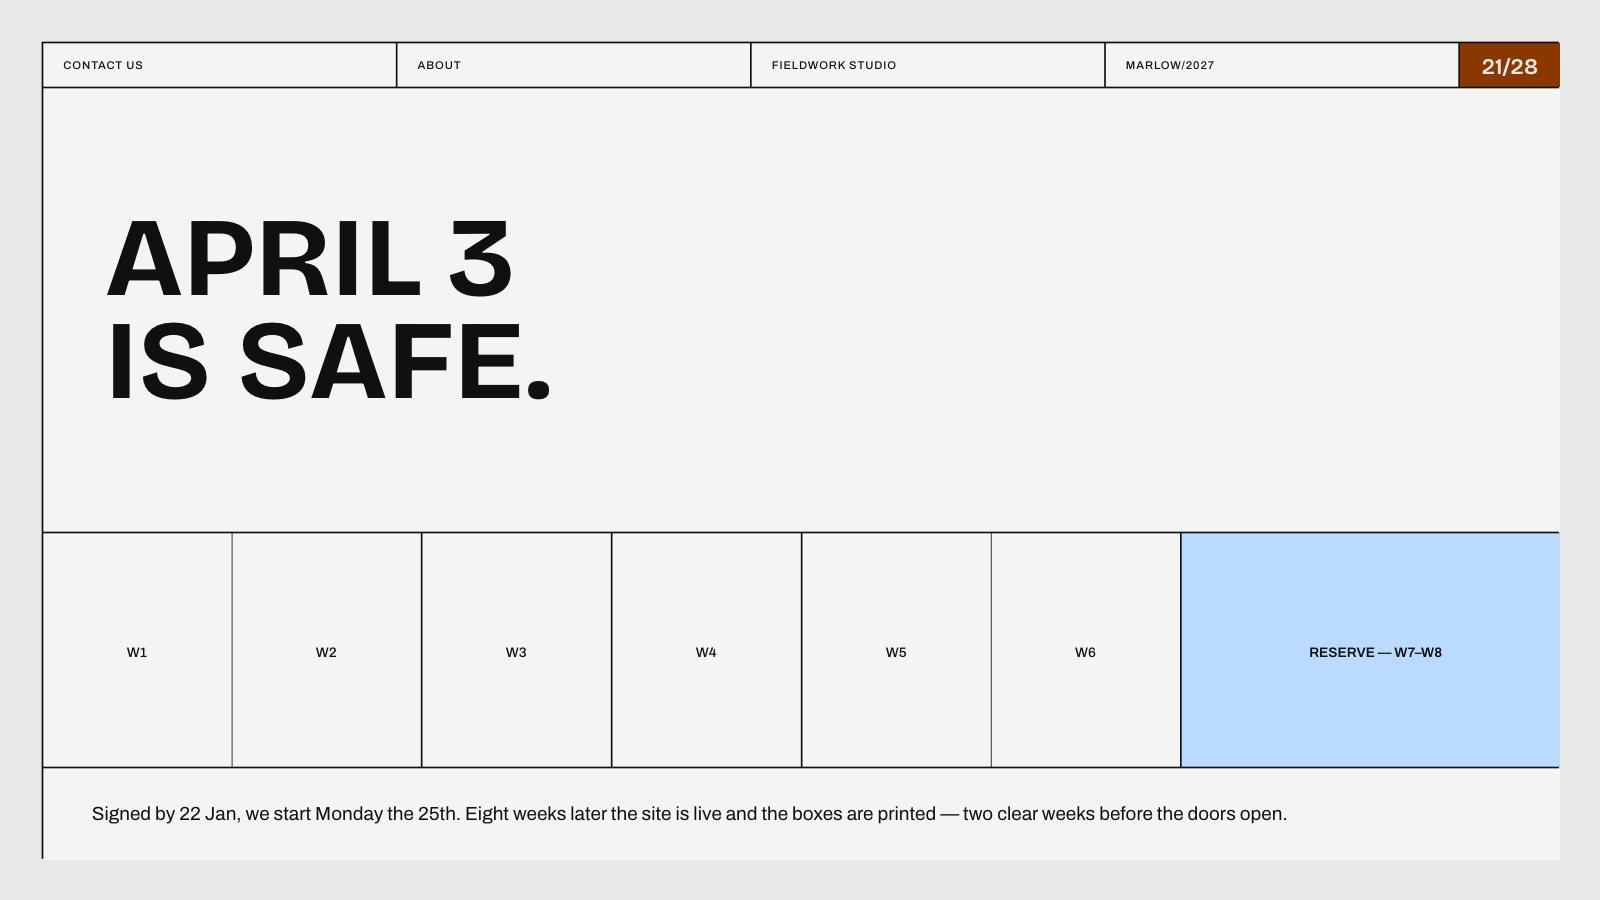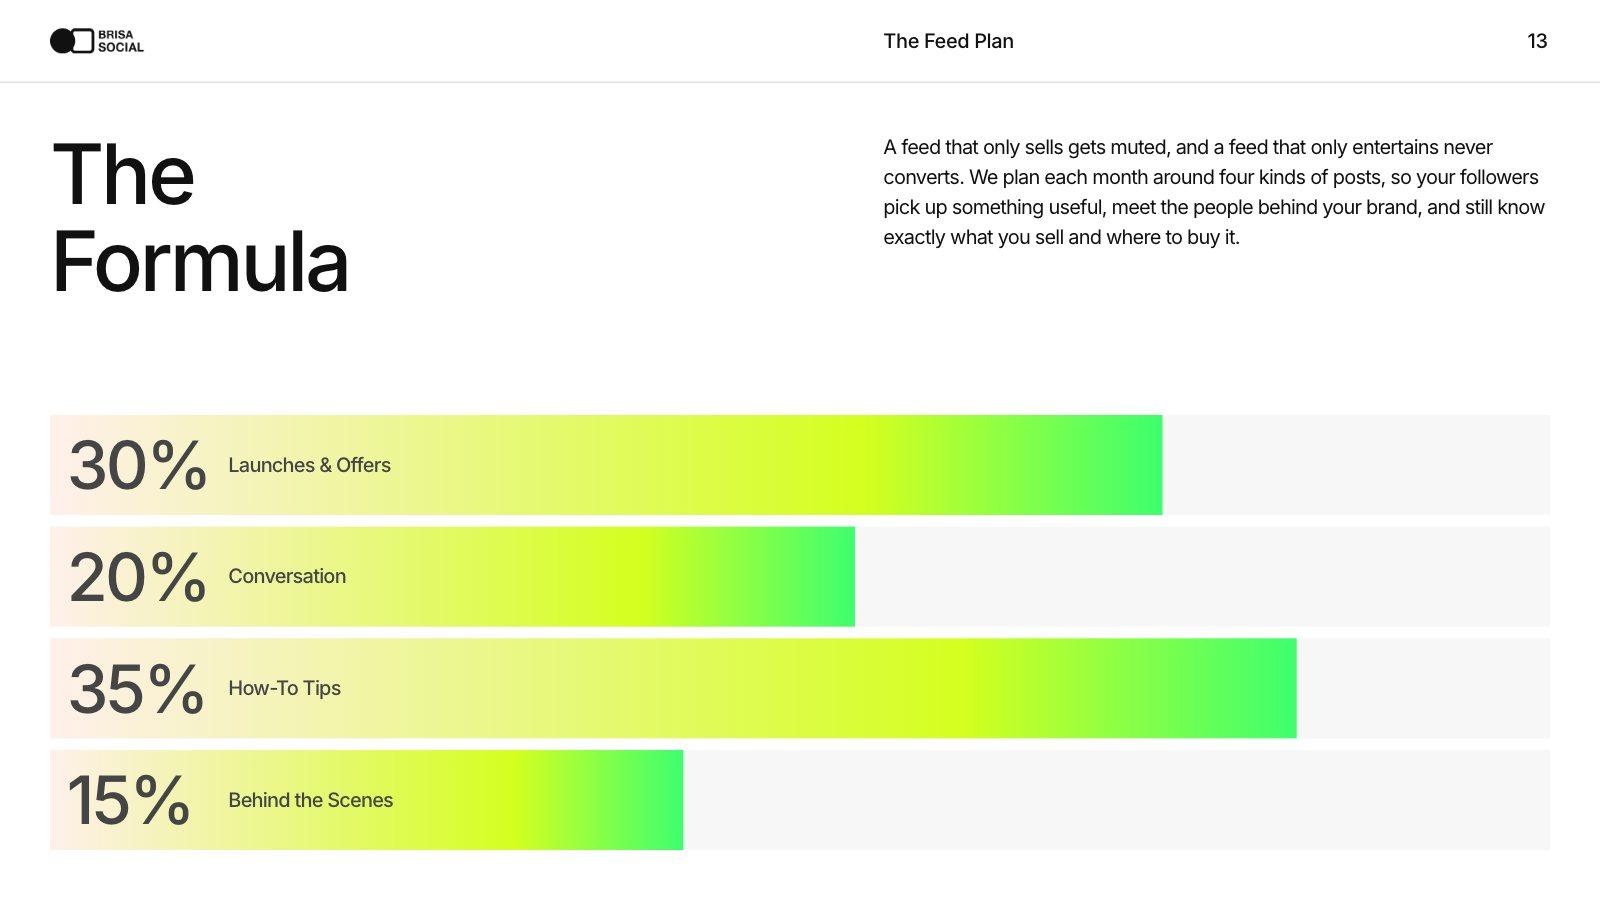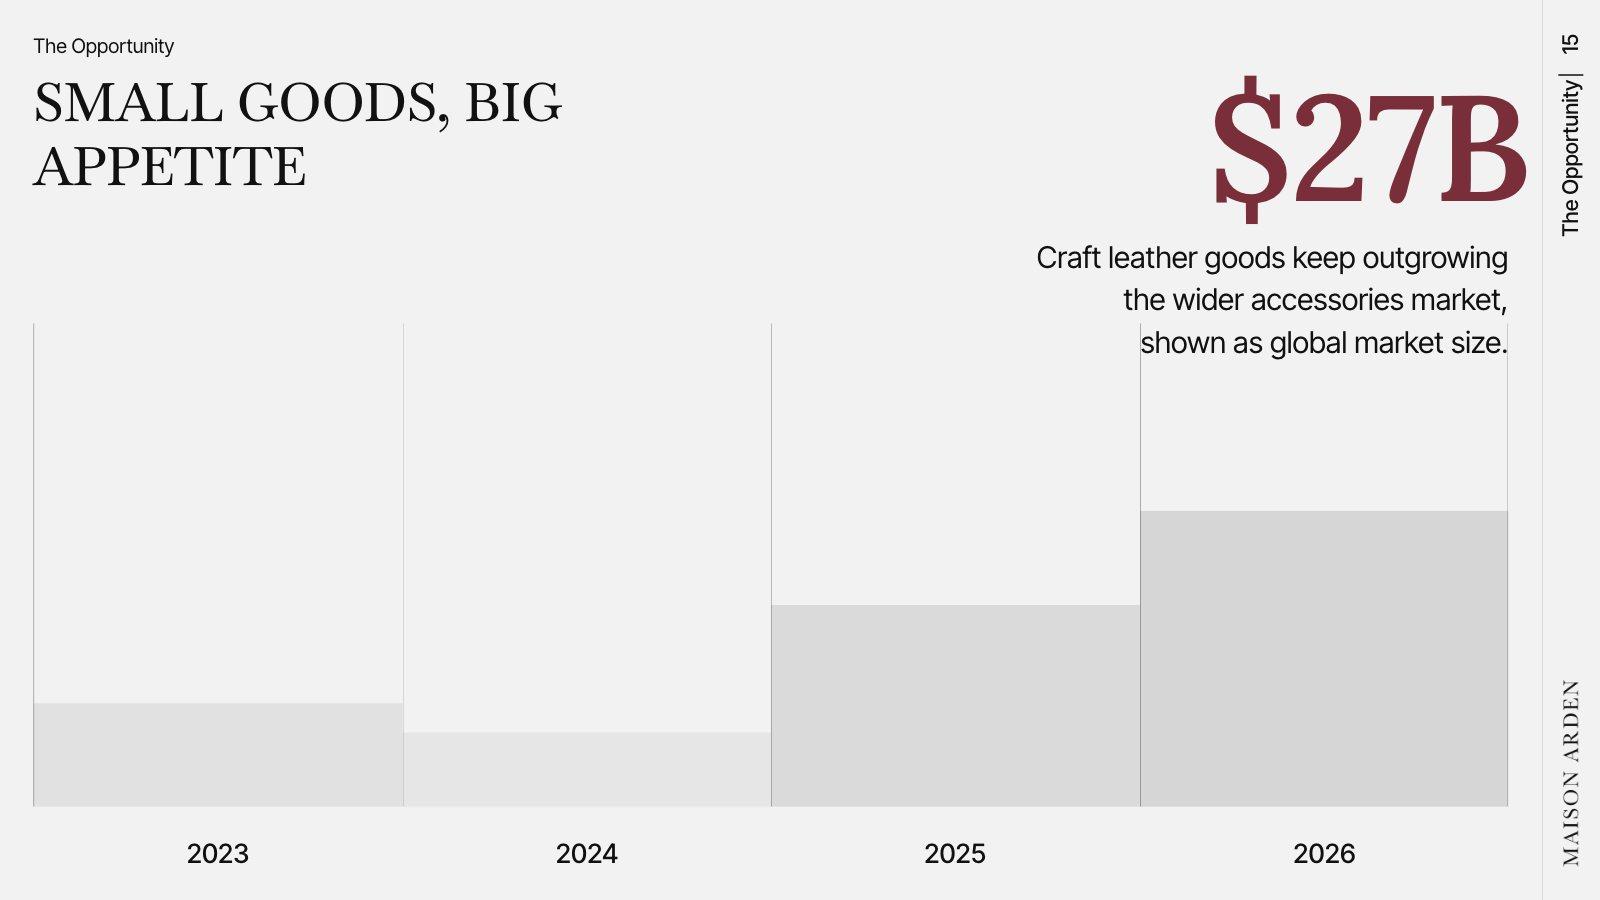
A chart on a slide has a few seconds to land. It should answer one question, and the title should say the answer.
Choose the chart for the question
| The question | Use |
|---|---|
| How did it change over time? | Line chart (or columns for a few periods) |
| Which is biggest? | Bar chart, sorted from largest to smallest |
| What’s it made of? | Stacked bar — or a donut for two or three parts |
| How does one number compare? | One big number, with its comparison underneath |
Highlight one thing
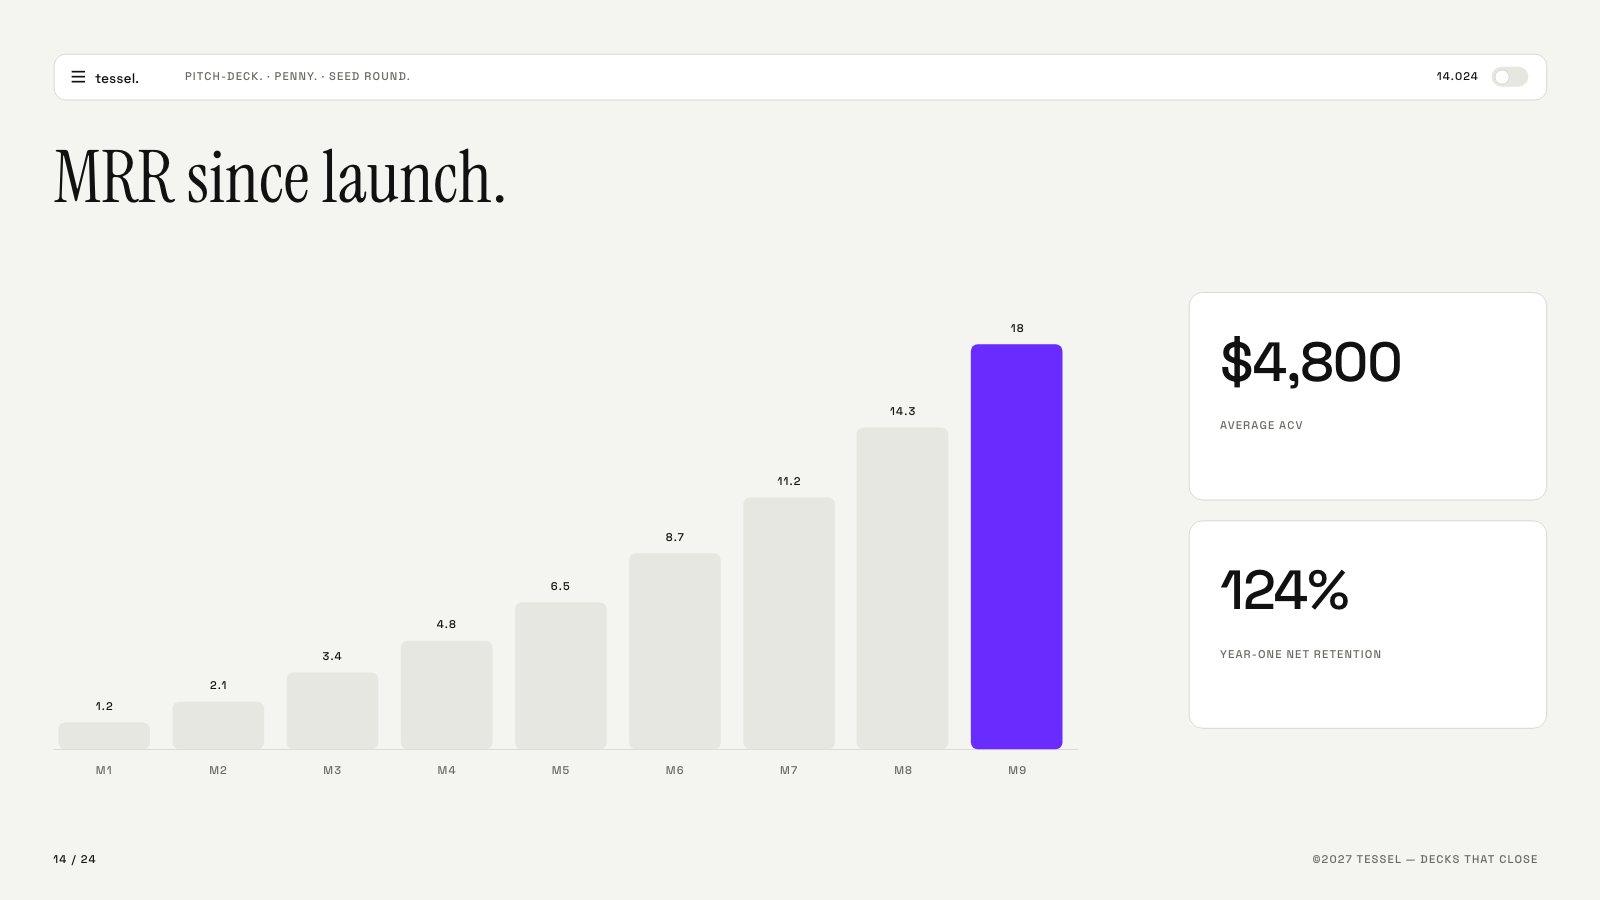
Color the bar, line or segment that matters in your accent color and make everything else grey. The audience looks where the color is.
Small habits that help
- Round. 38% beats 37.84%; $2.1M beats $2,093,442. Precise numbers belong in the appendix.
- Label directly on the bars or lines instead of using a legend.
- Start bars at zero. Cutting the axis makes small differences look huge.
- Give context. A number means little alone: versus last quarter, versus target, versus the industry.
- One chart per slide. Two charts side by side split attention.
Try this prompt
A 6-slide usage review for Halcyon Logistics from the attached report. One chart per slide, each with a full-sentence title that states the takeaway. Round the numbers.
halcyon-usage.pdf